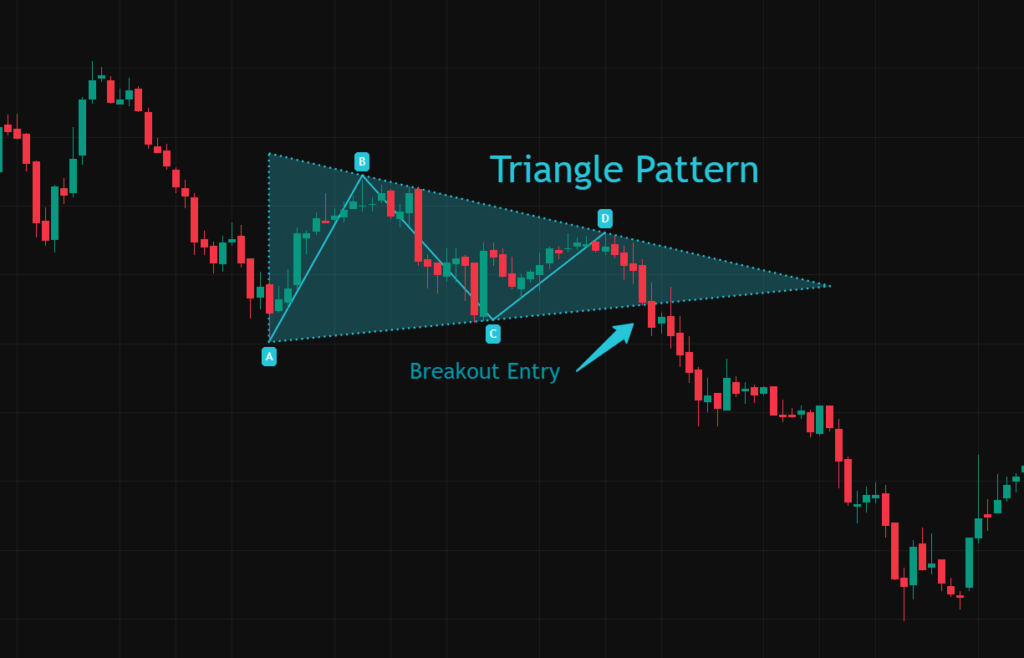
Triangle patterns are among the most recognizable chart formations in technical analysis, often appearing before powerful breakout movements. These patterns reflect a period of price compression where buyers and sellers gradually move toward equilibrium before one side takes control. But what is triangle pattern trading? Triangle pattern trading is a breakout-based strategy that focuses on identifying triangle formations on price charts and entering positions when price moves decisively beyond the pattern’s boundaries.
In this comprehensive guide, we will cover:
- What is triangle pattern trading?
- What are different types of triangle chart patterns?
- How to identify triangle formations?
- How to trade triangle patterns?
- How to calculate triangle pattern targets?
- Risk Management In Triangle Pattern Trading
In this Linixbit article, we will break down each of these concepts step by step, moving from foundational theory to practical trading strategies. Whether you are a beginner trying to understand chart patterns or an experienced trader refining your trading strategy, this article will give you the clarity and structure needed to approach triangle pattern trading with confidence and precision.
What Is Triangle Pattern Trading?
Triangle pattern trading is a technical analysis strategy centered around identifying triangle formations and trading their breakouts. These formations develop when price moves within converging trendlines, signaling a contraction in volatility before an expansion phase. Rather than entering trades during consolidation, traders wait for price to break above resistance or below support. The breakout often marks the beginning of a new impulsive move. Because the structure provides clear boundaries, it allows traders to define entry points, stop-loss levels, and projected targets in advance. This approach is widely used across forex, stocks, cryptocurrencies, and commodities, making it one of the most used breakout strategies in technical trading.
What Are the Three Main Types of Triangle Chart Patterns?
Triangle formations are generally classified into three categories: ascending triangles, descending triangles, and symmetrical triangles. Each type reflects a different balance of buying and selling pressure. Understanding the differences between these formations is essential before applying any breakout strategy, as the structure often provides clues about potential direction.
Ascending Triangle Pattern
An ascending triangle is typically considered a bullish formation. It forms when price repeatedly tests a horizontal resistance level while producing higher lows. This structure shows that buyers are becoming increasingly aggressive, gradually pushing price upward. Each pullback becomes shallower, indicating growing demand. Eventually, resistance weakens, and price breaks above it. When this breakout is accompanied by increasing volume, it often leads to strong upward momentum. Traders focusing on bullish breakouts commonly monitor ascending triangles within established uptrends.
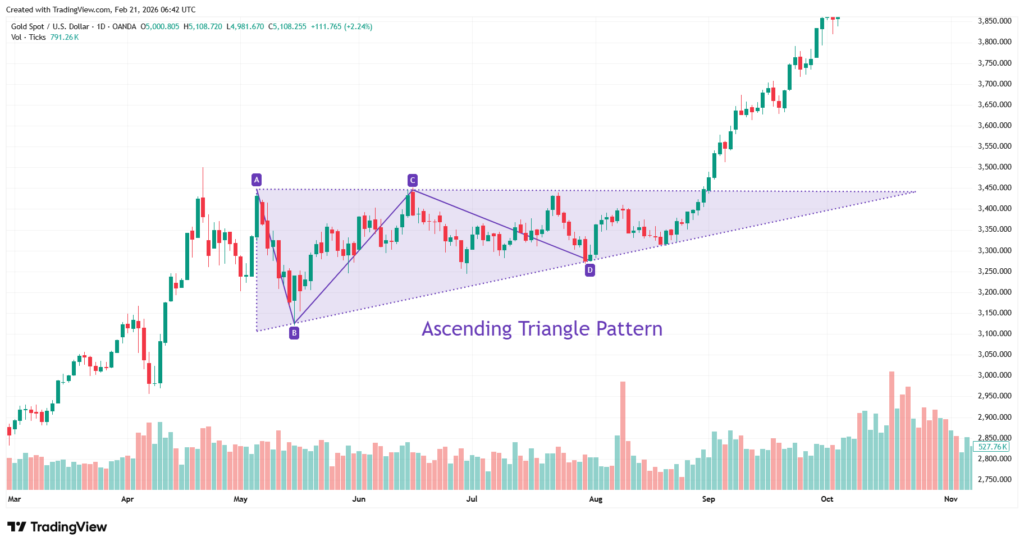
Chart 1: Ascending triangle pattern on Gold daily chart
Descending Triangle Pattern
A descending triangle is generally viewed as a bearish formation. It develops when price repeatedly tests a flat support level while forming lower highs. This pattern reflects increasing selling pressure. Each rally becomes weaker, signaling that sellers are stepping in earlier. When support eventually breaks, it can trigger accelerated downside movement, especially if stop-loss orders are clustered below the level. This formation is often seen during downtrends and can provide continuation opportunities when aligned with broader market weakness.
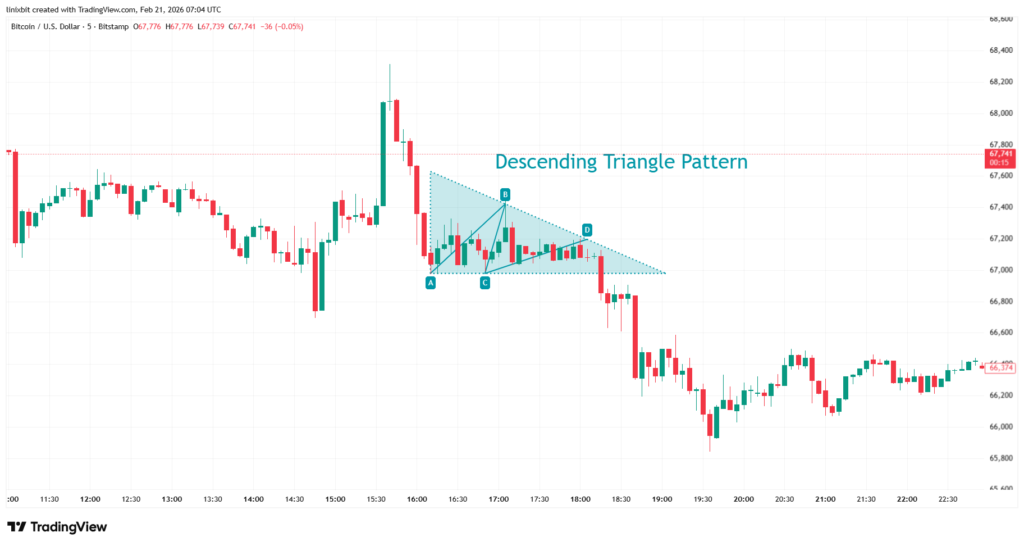
Chart 2: Descending triangle pattern on Bitcoin M5 chart
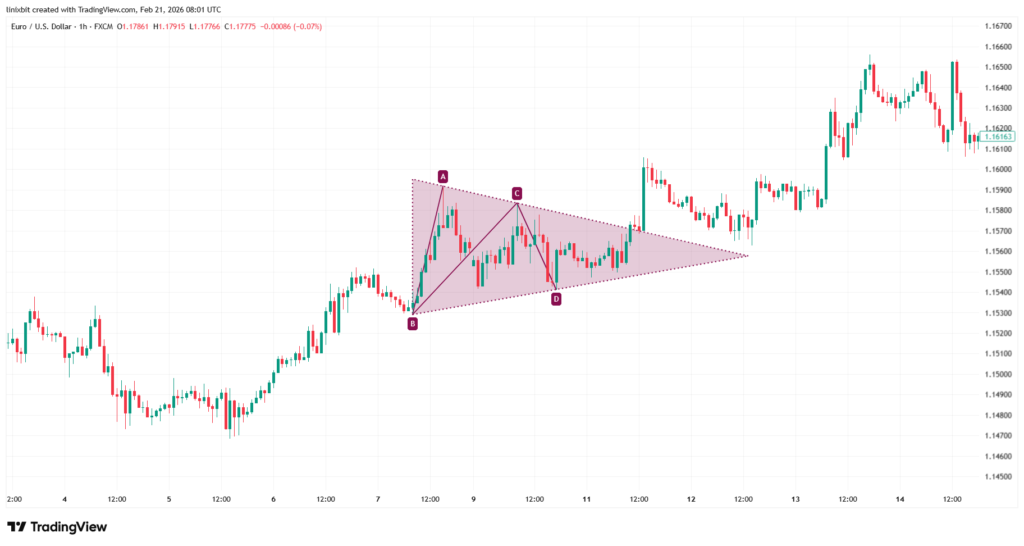
Symmetrical Triangle Pattern
A symmetrical triangle forms when both support and resistance trendlines converge toward each other. Neither buyers nor sellers dominate, and price volatility gradually contracts. Unlike ascending or descending triangles, this structure does not indicate direction in advance. Breakouts can occur either upward or downward. Because of this uncertainty, traders wait for confirmation before entering positions. Symmetrical formations are particularly common during periods of market indecision before major news events or trend continuation moves.
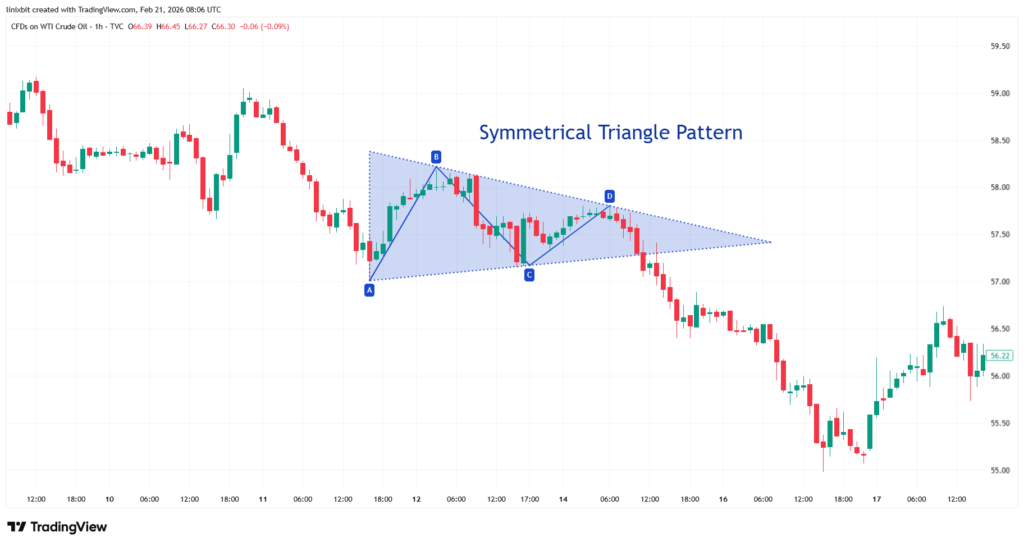
Chart 3: Symmetrical triangle pattern on the U.S. Oil H1 chart
How to Identify Triangle Formations?
Identifying a valid triangle pattern requires careful attention to structure and context. The first step is drawing two converging trendlines that clearly contain price action. There should be at least two touches on each boundary to confirm the pattern. Volume typically declines as the triangle develops, reflecting reduced participation during consolidation. This contraction is a key characteristic of authentic formations. Timing also matters. Breakouts ideally occur before price reaches the exact apex of the triangle. If price drifts too close to the tip without breaking out, the structure may lose momentum.
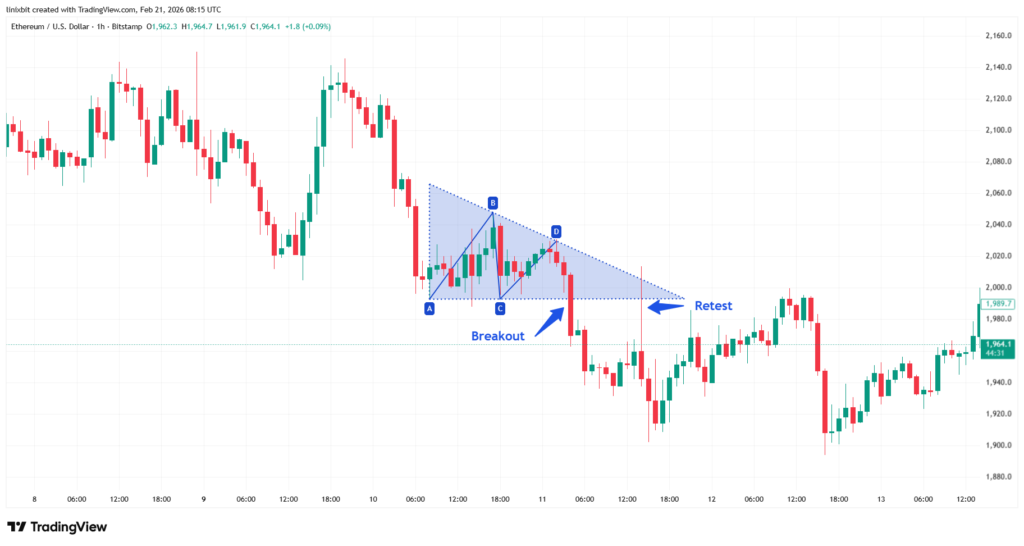
How to Trade Triangle Pattern Breakouts?
Trading triangle breakouts requires discipline and confirmation. The most common approach involves waiting for a decisive close outside the pattern’s boundary.For bullish breakouts, traders enter above resistance. For bearish breakdowns, entry occurs below support. Strong volume expansion during the breakout improves reliability and reduces the risk of false moves. Some traders prefer entering immediately after breakout confirmation, while others wait for a retest of the broken level. The retest method often improves risk-to-reward ratios but may not always occur.
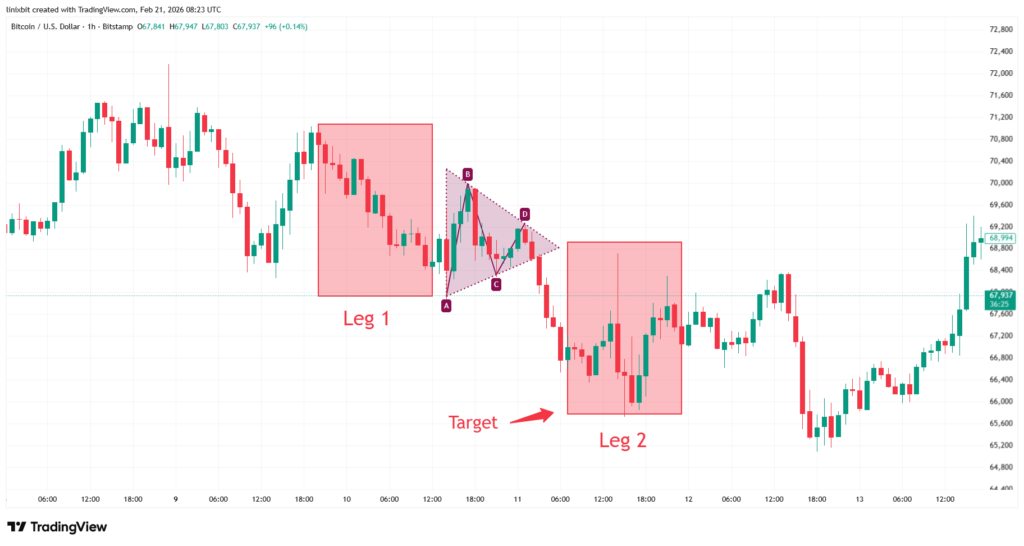
How to Find Triangle Pattern Targets?
Profit targets in triangle formations are commonly calculated using the measured move technique. Traders measure the height of the widest part of the triangle and project that distance from the breakout point. For example, if the base measures 30 points and price breaks upward at 200, the projected objective becomes 230. This method provides structure and consistency in planning trades. However, targets should not be applied mechanically. Traders should consider nearby support or resistance zones, overall market conditions, and volatility levels. Flexibility improves long-term performance.
Risk Management In Triangle Pattern Trading
Risk management is crucial when trading breakout formations. False breakouts are common, especially in low-liquidity environments or during major economic events. A common stop-loss placement is just inside the opposite side of the triangle. For upward breakouts, stops are placed below broken resistance or the most recent swing low. For downward moves, stops are placed above broken support. Position sizing is equally important. Most professional traders risk only a small percentage of capital per trade, typically between one and two percent.
Final Thoughts
Triangle formations remain one of the most practical and widely respected chart structures in technical analysis. Their ability to signal volatility compression before expansion makes them valuable tools for breakout traders. By understanding what is triangle pattern trading, learning to identify valid formations, calculating realistic targets, and applying disciplined risk management, traders can build a structured and repeatable system. No trading strategy guarantees profits. However, when applied with patience and confirmation, this breakout approach can become a powerful component of a professional trading plan.
Frequently Asked Questions (FAQs)
1. Is triangle pattern trading suitable for beginners?
Yes, triangle pattern trading is beginner-friendly because it provides clear structure, defined entry points, and measurable targets, making it easier to build disciplined trading habits.
2. Do triangle patterns work on all timeframes?
Triangle patterns can appear on all timeframes, from intraday charts to weekly charts, but higher timeframes generally produce more reliable breakout signals.
3. How reliable are triangle pattern breakouts?
Triangle breakouts can be highly effective when confirmed with strong volume and aligned with the overall trend, but false breakouts are still possible.
4. What is the best timeframe for trading triangle patterns?
There is no single best timeframe, but many traders prefer H1, H4, and daily charts because they reduce market noise compared to lower timeframes.
5. Should volume be considered when trading triangle patterns?
Yes, volume is important. Declining volume during consolidation and increasing volume during breakout strengthens the validity of the pattern.
6. Can triangle patterns signal reversals?
While they are commonly continuation patterns, symmetrical triangles in particular can sometimes act as reversal setups depending on the breakout direction.
7. What happens if price reaches the apex without breaking out?
If price reaches the apex without a decisive breakout, the pattern often loses strength and may result in a weak or choppy move.
8. How many touches are needed to confirm a triangle pattern?
At least two touches on each trendline are generally required to validate a triangle formation.
9. Can triangle patterns be combined with indicators?
Yes, combining triangle setups with indicators such as RSI, MACD, or moving averages can improve confirmation and overall trade accuracy.
10. Is triangle pattern trading better in trending or ranging markets?
Triangle pattern trading tends to perform better in trending markets where breakouts align with broader momentum.
Expand Your Trading Knowledge with Linixbit on YouTube.