In technical analysis, traders use chart patterns to identify potential price movements based on historical data. One of the most popular patterns that traders look for in their analysis is the flag pattern. But what is flag pattern in trading? A flag pattern is a continuation chart formation that occurs during a strong price trend, either upward or downward. It signals a brief pause or consolidation in the market before the price resumes its original trend.
The pattern is called a flag because the price action forms a rectangular shape that resembles a flag on a flagpole. Typically, the flag pattern consists of a sharp price movement, followed by a period of consolidation, and then a breakout that resumes the prior trend.
In this article, we will explore what is flag pattern in trading, its elements, identification, and effective trading of the flag pattern. The strengths and limitations of this pattern, practical examples, and tips for successful flag pattern trading will also be discussed. After reading through this article, you will be in a good position to know how to apply flag patterns in your trading strategy.
The Anatomy of a Flag Pattern
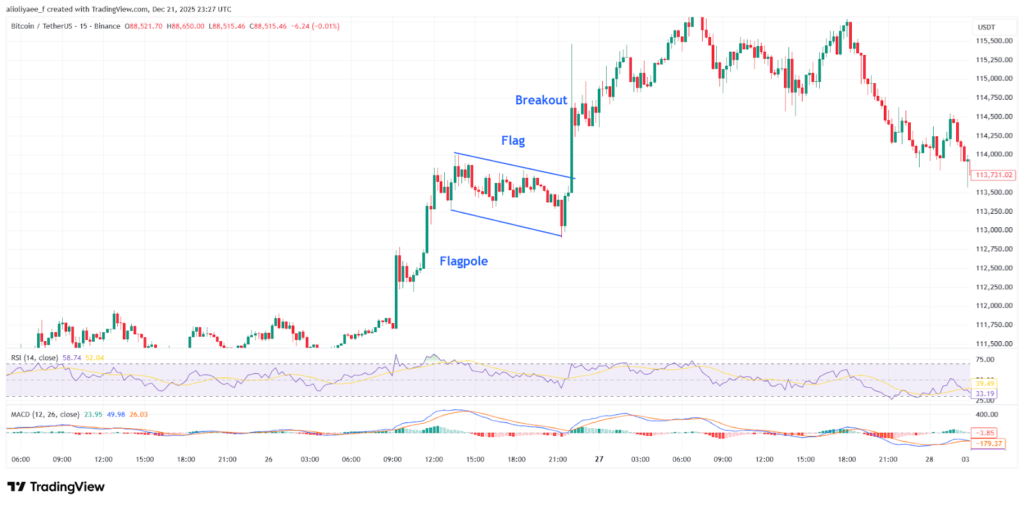
A flag pattern is one of the classic continuation patterns in technical analysis. It indicates that once a sharp movement has taken place, the price reforms shortly and then returns to its previous direction. To get a clear picture of this pattern, it can be divided into three sections: the flagpole, the flag, and the breakout. Find out what and why each section is important to traders.
Flagpole
The first and strongest price movement that initiates the formation is the flagpole. It occurs quickly and decisively, and it does not take long, indicating the dominance of buyers or sellers in the market. The flagpole in a bullish flag is a sharp upward spurt with intense buying pressure, above-average volume, and rampant participation and confidence. In a bearish flag, the flagpole is a steep decline in a market characterized by intense selling. A taller and stronger flagpole tends to anticipate a more vigorous continuation following consolidation. Technical chart analysis indicates that this first wave reflects strong market sentiment and the creation of a trend that the flag pattern attempts to follow.
Flag
Price then goes into a period of consolidation, creating the flag after the flagpole. This phase is a loosening period of time in which the market pauses temporarily, and the price moves around a small band within two trendlines forming a small channel or a rectangle. The flag tends to have a slight angst towards the movement preceding it- downward in a bullish flag, or upward in a bearish flag; however, the slope can be changed.
The important thing is that there are no new trend highs or lows being made at this time. Such consolidation is an indication of balance between buyers and sellers as the first in to the game takes profits and others evaluate the second step. Volume will tend to decrease, which signifies a short-term decrease in trading before it gains momentum again. Analysts remark that this stage is short-lived as compared to the flagpole, and the more tightly the price action, the more distinct the pattern on the chart.
Breakout
The trend is complete when the price shatters out of the consolidation range of the flag towards the initial trend. In both bullish and bearish flags, what is flag pattern is suggesting is the direction of the breakout. In the case of a bullish flag, this implies that it will increase above the upper limit; in the case of a bearish flag, it will decrease below the lower limit. The presence of a noticeable rise in volume is an indication of a valid breakout and a new commitment of the market players, and justifies the continuation of the previous move. It is a high-probability continuation trade breakout.
There are numerous tactics in which the height of the flagpole is used to project a possible target of the post-breakout action. Professional traders note that volume patterns, which are low in the consolidation period and then widen at the breakout, are used to differentiate between real and fake signals and enhance the accuracy of this pattern of continuation when other types of analysis are used.
Types of Flag Patterns
One of the most common and broadly used patterns in continuation chart patterns in technical analysis is flag patterns, which are used to predict the continuation of a trend after a certain time has elapsed as a result of consolidation. These patterns can be broadly divided into two categories: bullish flag patterns and bearish flag patterns. Both these signals suggest that the market will probably proceed in the same direction as the initial trend after the price leaves the consolidation period; however, they are of opposite trend direction, and they have different visual appearances.
Bullish Flag Pattern
What is bullish flag pattern in trading? When the upward trend is strong, a bullish flag pattern is created. The trend starts with a steep and sharp increase in price; the first steep increase is called the flagpole. Once the burst up, a brief period of short consolidation follows during which the price is usually moving sideways in a more or less downward direction within a narrow channel to create the flag itself. This consolidation is usually like a downward-sloping rectangle or channel that has a lower volume compared to the previous run-up and represents a momentary rest period as traders take profit or await further movement.
The key trait of a bullish flag is that the price does not correct much of the gains that it has been enjoying, and usually it corrects at a rate of at most 30-50 percent of the height of the flagpole before beginning to rise again. When the price starts to rise beyond the upper trendline of the flag with rising volume, it is considered to be the continuation of the uptrend, and the breakout is considered by many traders as a good indication to take a long position.
Bullish flags are especially useful in markets where the bullish momentum is high since they provide specific entry points: once the market breaks above the upper limit of the flags, it is clear that the market remains in the control of the buyers. Bullish flags are trading strategies that usually involve the use of stop-loss orders at the lower end of the flag to control the risk they present.
Bearish Flag Pattern
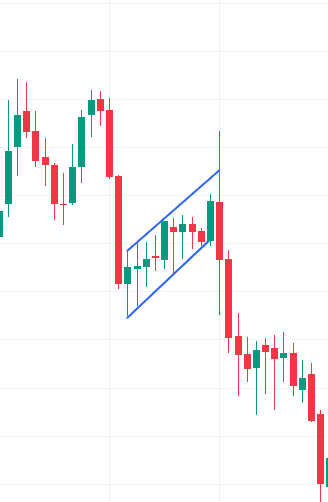
What is bearish flag pattern in trading? A bearish flag is displayed in a declining trend. The trend starts with a steep decline in price, once more creating the flagpole, except that this time it is in the opposite direction. Following this sharp decline, the price gets into a period of consolidation in which the price is more inclined to move either a little bit upwards or horizontally within a narrow band. Similar to its bullish counterpart, this consolidation indicates a transient stoppage; here, it indicates sellers temporarily withdrawing before the second round of the selling pressure.
The bearish flag consolidation usually takes the form of an upward-sloping channel or a small range that reverses a part of the fall of the flagpole without canceling it. In this stage, the volume usually stays low or constant compared to the first sell-off. The price breaks below the lower trendline of the consolidation channel, and there is an increase in volume, which is an indication of the continuation of the down trend. The traders take this disintegration as a signal to buy or increase short positions to attract further losses.
Bullish and bearish flags offer traders a clear point of entry, stop-loss, and profit targets. The typical method is to put a stop-loss right above the upper limit of the flag pattern to guard against the false breakouts and to reference the height of the flagpole projected off the breakout point to set profit goals.
Similarities of Bullish Flag Pattern and Bearish Flag Pattern
Despite opposite trends between bullish and bearish flag patterns, both of them have a few similar aspects: they start with a sharp impulsive movement (the flagpole), go through a short period of consolidation (the flag), and end with a renewal in the general direction of the trend. The reason why these patterns are popular among traders is the fact that they are generated within the existing trend, thus providing a signal that is consistent with the momentum but not the reversal.
One of the lessons is the dynamics of volume. In both the bullish and bearish flags, the first trend ought to be heavy volume, the second trend ought to be a shrinkage in volume, and the third trend ought to be a breakout that is followed by a pick-up in volume, which will indicate that there is a renewed commitment in the direction of the trend.
What Is Flag Pattern and How to Find It?
The ability to spot a flag pattern is an important technical analysis skill as it enables traders to understand when a good price trend is likely to persist following a short break. A flag pattern is a sudden, sharp price movement, then a consolidating period, and lastly a breakout in the same direction as the initial trend. This series indicates a short-term balance between the buyers and sellers until momentum is reclaimed in the direction of the original trend.
Step 1: Spot a Strong Trend
The initial step in detecting a flag pattern is to find a powerful, fast price movement, which is the flagpole. The flagpole is an important driver for buyers or sellers and must be identifiable on the chart as a sharp increase or decrease. A good flagpole is often an indication of good market movement with above-average volume that further strengthens the trend. In cases where the first trend is obvious and strong, the chances of a valid flag pattern developing are high.
Step 2: Look for the Flag
Once the flagpole forms, the price action is expected to enter a small trading range, forming the flag section of the pattern. This period of consolidation is often in the form of a narrow channel with the prices going sideways or a little against the direction. At this stage, traders are basically taking a breath, and the volatility in prices is reduced as the market processes the previous move. The flag in itself is framed by two parallel or almost parallel trendlines, which encompass price action within the specific range.
Step 3: Check the Slope
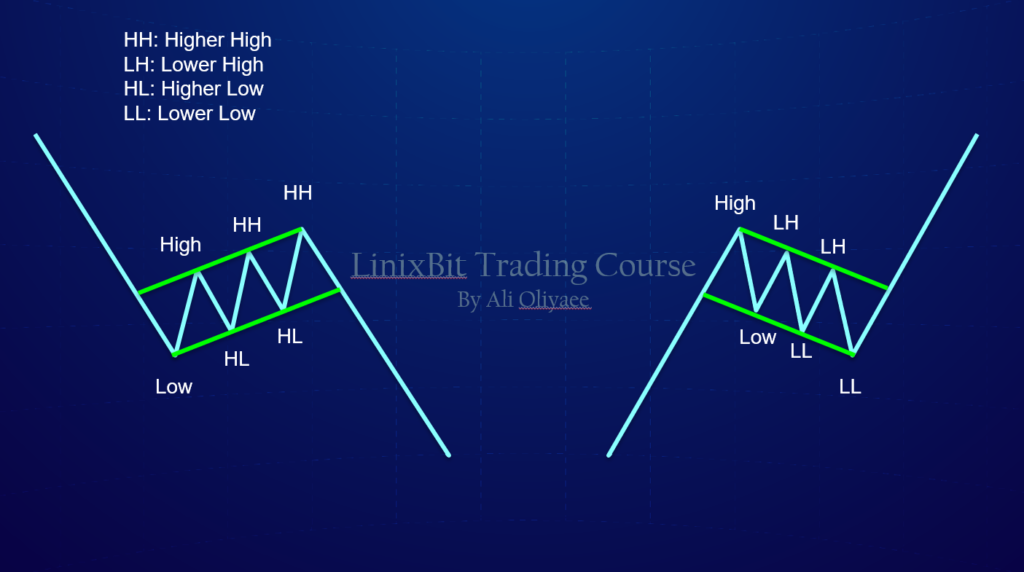
Another significant visual sign is the slope of the flag. The consolidation phase in a bullish flag formation usually has a slight downward slope compared to the previous uptrend. On the other hand, the consolidation in a bearish flag pattern may have a slight upward slope against the trend of the previous decline. Though the slope does not necessarily have to be steep or ideal, the most important feature is that the consolidation is confined within a range between approximately parallel trendlines, and moves somewhat opposite to the prevailing trend. This contrasting slope is used to make the flag stand out of the other patterns and make the temporary character of the correction.
Step 4: Confirm the Breakout
The last and most important thing in determining a flag pattern is the breakout of the consolidation zone. The breakout must be in the direction of the initial trend: above the upper limit in case the flag is bullish and below the lower one in case the flag is bearish. A valid breakout is typically characterized by higher trading volume, an indicator of new involvement and belief of market participants. This volume growth aids in distinguishing a real breakout and a fake move that may soon revert and confuse traders. Traders should only take the pattern as confirmed after the breakout and show follow-through.
In the event that these factors are observed in order, a powerful trend, a narrow consolidation, a positive slope, and an established breakout, traders are almost certain that the current trend will persist. The identification of this sequence assists traders in timing the entries more accurately, making rational stop-loss orders, and establishing profit targets based on the magnitude of the flagpole projected from the breakout point.
Trading Strategies Using Flag Patterns
Flag patterns are most profitable when traders have clear entry rules, accurate exits, strong risk management, and specific profit objectives. They ensure that they trade without emotionality and become more consistent.
Breakout Entry Strategy
Trading flag patterns is most often done by the breakout entry strategy. It is the act of getting into a trade as soon as the price comes out of the zone of consolidation of the flag in the direction of the trend. In a bullish flag, traders enter long positions when the price closes above the upper end of the flag, better still with increased volume. Increased volume validates the move and minimises the possibility of a false breakout.
On the other hand, where traders shorted the price, and at the end of the day the price is lower than the lower edge, and the traders are again seeking higher volume, it is a bearish flag. Popular entries are the breakout entries, as the traders can enter the trend at the beginning and get a bigger portion of the movement when the trend is complete.
Pullback Entry Strategy
Another, more conservative approach is the pullback, or retest entry approach. Instead of making a purchase or sale at the time of the breakout, the trader awaits a recession in the direction of the breakout point. In a bullish case, the price can rebound and check the resistance of the flag as support. The re-entry on this retest can usually provide a more favorable risk-reward profile and can be tighter than the previous level of resistance, which has turned into a support level.
In a bearish scenario, as the price drops below the support, it can go back to the same level, testing the same level, and then move further down. Waiting on a pullback tends to reduce the chance of a false breakout and provides a more attractive price of entry. Nevertheless, there may be no pullback, and the trader may miss the move.
How to Set a Stop-loss in Flag Pattern Trading?
Risk management is a necessity. Placing a stop loss prevents losses in case of the failure of the flag or an abrupt price change in the opposite direction. In the case of bullish flags, the stop is located right below the low of the consolidation area. This level nullifies the trend when violated. In bearish flags, the stop should be placed just above the high of the consolidation zone. The level implies that the continuation thesis is not valid anymore. Tight stops control risk, and have to allow normal volatility. Volatility-based stops are adopted by some traders, including a multiple of the ATR, to suit the evolving market conditions.
What Is Flag Patter Target?
Once a trader enters a trade, he/she must have a realistic profit goal. One of the most common ways is to measure the height of the flagpole (the first sharp movement) and project the same distance from the breakout point. As an example, when the flagpole increased by 20 points, the target should be 20 points above the breakout point.
Trade Management and Trailing Stops
Most traders follow their stop-loss through the trade instead of having a set target. The stop may follow a moving average (such as the 20 50 period MA) or recent swing lows in case of long trades and swing highs in case of short trades. Trailing prevents locking in profits and automatically exits the market in case the market turns against the trader by a specified margin.
Integrating Flag Patterns, Volume, and Other Indicators
Traders tend to reinforce flag strategies with other technical tools. The volume analysis plays an important role: the volume should be high at the breakout and low in the process of consolidation, which is a sign that the flag is merely a rest. Momentum direction and strength can be verified by such indicators as RSI, MACD, or moving averages. Placing multiple signals prior to opening a trade enhances the reliability of the setup.
Risk-Reward and Position Sizing
Disciplined traders compute the risk-reward ratios and position sizes. One of the most common goals is a 1:2 or 1:3 risk-to-reward ratio, i.e., profit will be at least twice or three times the risk. The size of the positions must be commensurate with the risk-taking propensity as well as the size of the account, typically risking 1-2 % of the capital on a single trade. That cushions capital when it is being drawn and increases trading life.
Advantages and Disadvantages of the Flag Pattern
While exploring what is flag pattern in trading we understood that one of the more accurate continuation patterns in technical analysis is the flag pattern because it has a distinct structure and has established entry and exit levels. The flag pattern, however, has its shortcomings just like any other pattern in technical analysis. Let us discuss the advantages and disadvantages of the flag pattern.
Strengths of Flag Patterns
Continuation patterns Flag patterns are some of the most popular continuation patterns in technical analysis, as they provide traders with a number of unique benefits:
Easy to Understand and Identify the Structure
The shape of the patterns of flags is simple and unique, a strong price move up with a short and consolidating pattern resembling a flag on a pole. This ease of recognition by traders is due to its simplicity over complex chart patterns, particularly in times when price consolidates in tight, parallel channels.
Good with Trend Continuation Trading
The flag patterns are particularly beneficial to the trend-following strategies due to the fact that they appear within an existing trend and indicate that the trend is likely to continue. Traders who like to enter positions based on the direction of the market momentum can use flag patterns to enter at the right time after the end of consolidation.
Offer Specified Entry and Exit Levels
Patterns of flags provide natural logical points of entry (breakouts above/below the flag), of placing stop-loss (just outside the other side of the pattern), and of estimating the profit target (commonly by the height of the flagpole). These transparent levels aid traders in establishing trades with systematic risk management and reward anticipations.
Relevant in most markets and time periods
Patterns of flags do not apply to a single asset. They are employed in stocks, forex, commodities, futures, and even cryptocurrencies by traders, and may be displayed on an intraday, daily, or weekly basis. This wide generalization renders them useful both in short-term and long-term trading strategies.
Reflect Market Psychology
The flag pattern is a real market phenomenon in that the initial sharp move is due to momentum, followed by a short period of equalization of buying and selling power, and the momentum continues. This is a representation of real supply and demand forces, which is regarded by many traders as a strength of the pattern.
Weaknesses of Flag Patterns
However, flag patterns, useful as they are, have a few limitations that a trader should know about:
False Breakouts Have the Potential to Mislead Traders
All the outbursts of a pattern of flags do not result in the continuation of the trend. When liquidity in a market is low or the market is choppy with price movements, the prices tend to break out of the flag and then soon revert to their initial path, causing false signals and possible losses.
Pattern Identification Subjectivity
Though the ideal pattern of the flag has some clearly defined parallel trendlines, practically, some interpretation can be subjective. The flag channel could differ for two traders, and thus the conclusion reached could be the breakout point.
Can Be Confused with Similar Patterns
Patterns of flags may be similar to other chart patterns, e.g., pennants or rectangles with small slopes, which vary slightly in form and meaning. Failure to identify these patterns properly may result in wrong trade decisions unless traders are keen on analyzing the situation.
Reliability Depends on Market Conditions
Patterns of flags are most efficient when there is a strong, sustained trend. In sideways or volatile markets with heavy whipsaws, flag patterns are less effective because the price does not continue as expected after the consolidation.
Final Thoughts on Flag Patterns
In this article we broke down what is flag patter and how to identify it. The flag patterns are an effective technical analysis tool that assists traders in detecting possible trend continuations. The structure of the pattern, which is a flagpole, a period of consolidation, and a breakout, makes it relatively easy to identify and trade. When applied correctly, traders can get explicit entry and exit points and even predetermined risk-management policies. Nevertheless, like any trading instrument, the flag pattern is not infallible and can result in false breakouts in some markets. Traders can enhance the accuracy of the signal and enhance their success by confirming the breakouts using volume and with other technical indicators.
All in all, flag patterns can be added to the arsenal of every trader, especially those who follow a trend-following approach and want easy, practical trading setups. With knowledge of the flag pattern and relevant strategies, traders can improve their ability to capture profitable market moves.