In technical analysis, continuation patterns play a crucial role in helping traders stay aligned with market momentum. Among these patterns, the bullish flag pattern stands out as one of the most reliable and widely used continuation setups in trending markets. But what exactly is a bullish flag pattern? A bullish flag pattern forms after a strong upward price movement, followed by a short period of consolidation, before the price continues moving higher. It represents a temporary pause in an uptrend rather than a reversal. For traders who prefer momentum-based strategies, this pattern provides structured entry points, logical stop-loss placement, and measurable targets.
In this comprehensive guide, we will cover:
- What is a bullish flag pattern
- How to trade bullish flag pattern effectively
- Bullish flag pattern target calculation
- Risk management techniques
- Advanced bullish flag pattern trading strategies
By the end of this article, you will understand not only the structure of the pattern but also how to integrate bullish flag pattern trading into a disciplined and high-probability trading plan.
What Is a Bullish Flag Pattern?
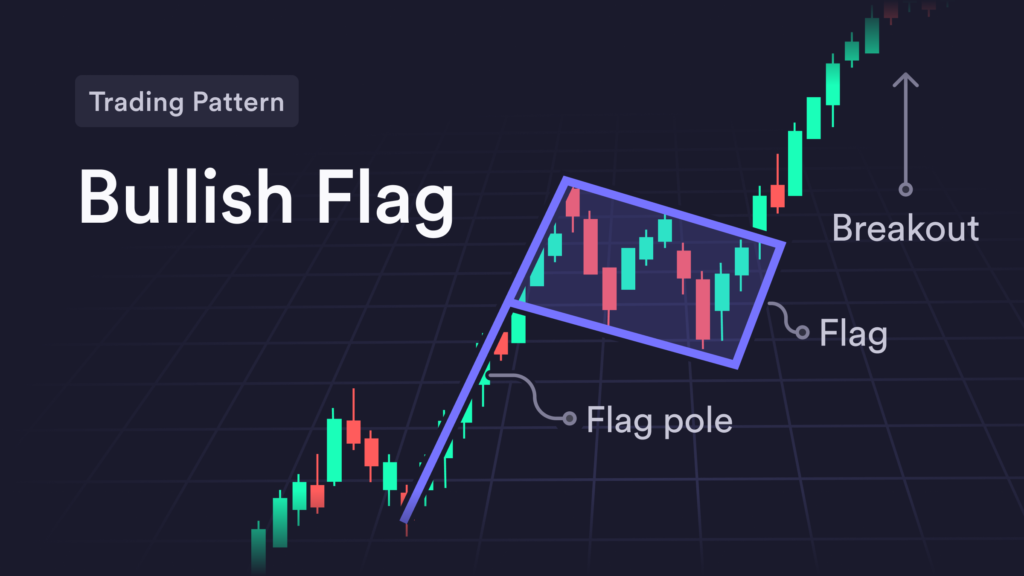
A bullish flag is a continuation chart pattern that constitutes a pattern that follows a high upward movement of the price. It is composed of sharp rally and a brief period of consolidation which slants slightly downward or moves horizontally. Price breaks and goes back to the initial upward trend after this pause. The design has the appearance of a flag on a pole. The first rally is the flagpole and the second one is the consolidation channel, which is the flag. When the price goes beyond the top limit of the consolidation, then the bullish flag is said to be complete.
The strength of this pattern is particularly its structure. It does not signal a reversal. Rather it confirms that the current positive trend still exists. Traders that know about trading bullish flag patterns apply this as a chance to enter into an existing trend instead of trying to predict one. This trend may be observed on different periods such as five-minute intraday charts and weekly charts. It is more reliable when it develops in the strong trending environments with evident bullish momentum.
What Is the Structure of a Bullish Flag Pattern?
The bullish flag pattern has three components that are necessary, and they include: the flagpole, the consolidation phase and the breakout. These are some of the aspects that are essential in understanding how to undertake the bullish flag pattern setup in the most effective way.
The Flagpole
The flagpole constitutes the first impulsive upward action. It is usually a vigorous surge that is fueled by vigorous purchasing power. It can be precipitated by good news, report on earnings, institutional accumulation, or a greater market breakout. A healthy flagpole will tend to exhibit high momentum, huge bullish candles and better than average trading volume. Market conviction is manifested by the strength of this move. The bullish flag pattern becomes largely ineffective without a good flagpole.
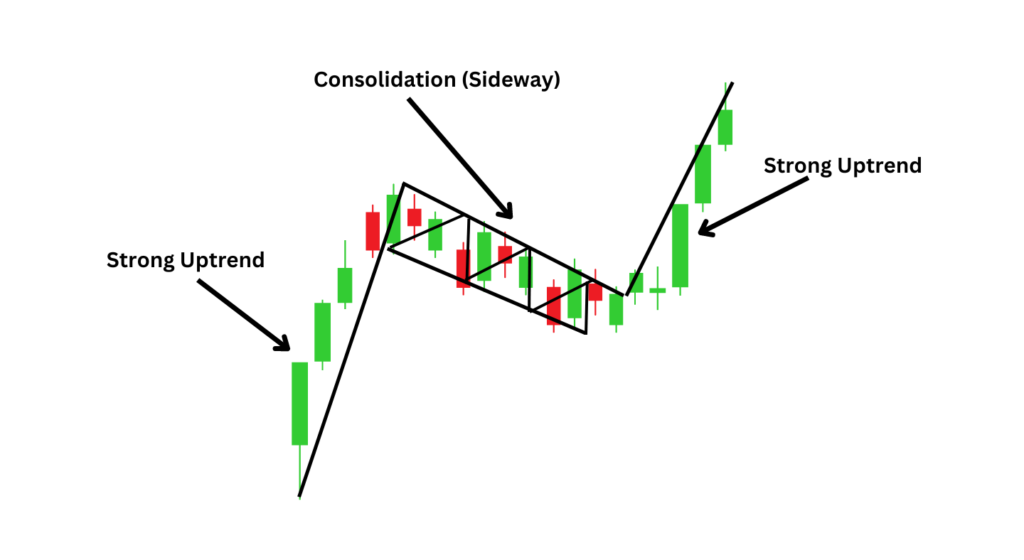
The Consolidation Phase
Price does not proceed directly up after the rally. Rather, it halts and starts consolidating. This merger usually creates a small channel that is inclined towards the downward or side-ways motion between two trendlines that are approximately parallel. In this stage, the initial customers make profits as new customers wait to be confirmed. The sellers can also seek to drive the price down, but they have low pressure. The volume normally declines at this time which means that the pullback is not strongly selling. The consolidation must be rather shallow in comparison with the flagpole. When the retracement is too deep the formation might cease to be a valid bullish flag pattern.
The Breakout
The last phase is when the price breaks out of the upper limit of the flag. This breakdown proves the fact that buyers are back in charge and the uptrend is reasserting itself. This break out in bullish flag pattern trading is the key entry signal. Ideally, it is supposed to be in increasing volume and heavy bullish momentum. A poor breakout that fails to expand volumes poses more risks of failure.
Why Does the Bullish Flag Pattern Work?
The bullish flag pattern is effective in the sense that it symbolizes a normal rest in a healthy upward trend as opposed to change in the market trend. The market is dominated by buyers in the flagpole stage. The pull gains pace and late entrants are scrambling to get into positions. After some time, the price starts being overextended and first movers start cashing in on gains. This temporary balance is reflected by the consolidation phase. There is selling pressure, which is controlled and limited. The market accepts the preceding action without majorly hurting the trend structure.
By the time the breakout takes place, it means that there is renewed interest of buying. Waiting traders come into the market, short sellers buy out, and institutional traders can increase long exposure. Such a combination contributes to the further development of the bullish flag pattern and supports the trend. That is why numerous professionals use the use of this trading pattern in the highly trending markets.
How to Identify a Bullish Flag Pattern?
Identifying a bullish flag pattern correctly is critical before attempting to trade it. First, confirm the presence of a strong uptrend. The market should be forming higher highs and higher lows with clear bullish momentum. Without a strong trend, the pattern becomes unreliable. Next, observe the consolidation. Draw two trendlines that contain the price movement within a narrow channel. The consolidation should appear orderly and controlled rather than volatile and erratic. Finally, wait for confirmation. A bullish flag pattern is not complete until price breaks above the upper boundary of the channel. Entering prematurely increases the risk of false breakouts.
How to Trade Bullish Flag Pattern Setups?
Trading a bullish flag pattern typically involves entering during the breakout or after a retest. The breakout entry method involves buying when price closes decisively above the upper trendline of the flag. This approach allows traders to capture momentum as the trend resumes, but it carries the risk of false breakouts in low-volume conditions. The pullback entry method is more conservative. After the breakout, price may retest the former resistance level, which now acts as support. Entering during this retest can improve the risk-to-reward ratio. However, price does not always retest, which means traders may miss some opportunities. Both methods are widely used in structured bullish flag pattern trading strategies.
Bullish Flag Pattern Target: How to Calculate Profit Objectives
The bullish flag pattern target is commonly calculated using the measured move technique. To determine the target, traders measure the height of the flagpole and project that same distance upward from the breakout point. For example, if the flagpole represents a 15-point move and the breakout occurs at 100, the projected target would be 115. This projection provides clarity and structure to the trade plan. However, traders should also consider nearby resistance levels and overall market conditions. In some situations, trailing stop strategies may offer greater flexibility than fixed targets. Proper bullish flag pattern target calculation enhances planning and improves long-term consistency.
Stop-Loss Placement and Risk Management
Even high-probability setups like the bullish flag pattern can fail. Effective risk management is therefore essential. A common stop-loss location is below the lower boundary of the consolidation channel. If price breaks below this level after the breakout, the continuation thesis becomes invalid. Some traders place stops below the most recent swing low, while others use volatility-based methods such as ATR multiples to adjust for market conditions. Regardless of the method, position sizing should ensure that no more than 1–2% of total capital is risked on a single trade. Disciplined risk management is what separates consistent bullish flag pattern trading from emotional decision-making.
Advanced Techniques in Bullish Flag Pattern Trading
Experienced traders often combine the bullish flag pattern with additional confirmation tools. Moving averages can strengthen conviction when the pattern forms above key dynamic support levels such as the 20-period or 50-period EMA. RSI can confirm momentum if it remains above 50 during consolidation. Volume analysis remains especially important: declining volume during the flag and increasing volume at breakout significantly improve reliability. Although no indicator guarantees success, combining technical tools can increase the probability that the bullish flag pattern breakout reflects genuine continuation.
Final Thoughts
The bullish flag pattern remains one of the most effective continuation formations in technical analysis. Its ability to identify temporary pauses within strong trends makes it particularly valuable for momentum traders. By understanding what a bullish flag pattern is, learning how to trade it with discipline, and applying accurate bullish flag pattern target calculations alongside proper risk management, traders can develop a structured and repeatable strategy. No chart pattern guarantees profits. However, when used correctly and combined with sound analysis, bullish flag pattern trading can become a powerful component of a professional trading approach.
Expand Your Trading Knowledge with Linixbit on YouTube.