
XRP price engaged in wide-ranging but non-directional trading between $2.388 and $2.423 on May 22, 2025. The price action remained mostly lateral with occasional sharp movements in both directions and temporary breakout attempts that failed to sustain. Bullish and bearish forces alternated control over short time periods to create a choppy trading environment. The trading session exhibited multiple RSI signals indicating overbought and oversold conditions which represented the continuing battle between buying and selling forces. The MACD indicator displayed varying market emotions through multiple golden crosses and death crosses that confirmed alternating periods of rising and falling trends.
XRP Price Reverses After MACD Signal, Then Retests $2.388 Support
XRP spent the beginning of the trading session consolidating within a tight range before its pressure pattern broke to the downside. The price movement to the intraday low of $2.388 at 00:14 UTC was triggered by a decisive full-body red candle which indicated a breakout. The MACD displayed a golden cross while the RSI moved into oversold territory which indicated a possible reversal.
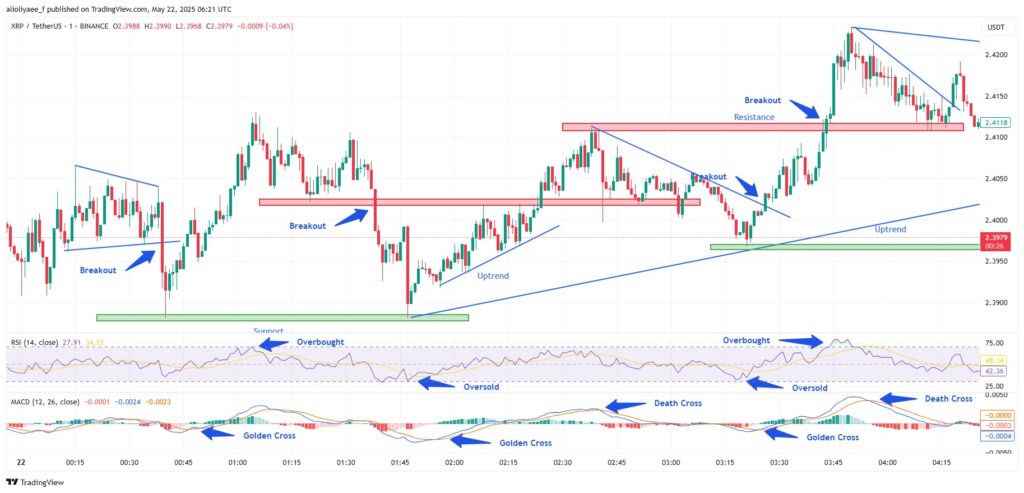
Chart 1: XRP/USDT M1 chart, Analyzed by alioliyaee_f, Published on Tradingview, May 22,2025
The signal triggered a recovery phase which propelled XRP price upward into a consistent uptrend that reached $2.413. The rally stopped due to the RSI reaching overbought territory. The appearance of a death cross on the MACD demonstrated declining bullish momentum. The support level broke down when a full-body red candle appeared and XRP price reached its session low of $2.388 at 01:47 UTC.
XRP Rebounds from Oversold Territory to Hit $2.423 Session High
At 01:47 UTC, RSI reached oversold levels again which suggested possible price recovery. This was confirmed just eight minutes later at 01: The MACD displayed a golden cross at the 01:55 UTC timestamp. Ripple price climbed to $2.411 by 02:38 UTC after these signals prompted steady recovery within an ascending channel. A brief price correction followed, triggered by a death cross on the MACD and at 02:40 UTC created a descending channel as a death cross appeared on the MACD.
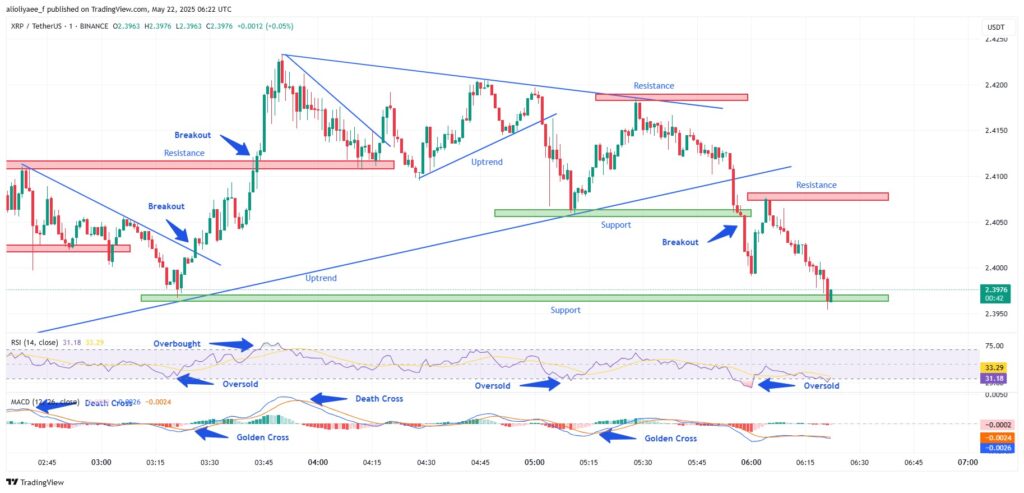
Chart 2: XRP/USDT M1 chart, Analyzed by alioliyaee_f, Published on Tradingview, May 22,2025
The decline continued until 03:21 UTC, when XRP hit $2.396. At this point, the downtrend lost momentum. The MACD displayed a golden cross formation while RSI indicated an oversold condition which resulted in a breakout through the upper boundary of the descending channel marked by a strong green full-body candle. Bullish control became evident and pushed the price above $2.411 resistance to hit the session’s peak at $2.423.
Golden Cross Sparks Brief Recovery Before Bearish Reversal at $2.418
XRP price peaked at $2.423 and indicated an overbought condition at 03:50 UTC alongside a death cross formation on the MACD which both signaled an upcoming market decline. The price entered the descending channel as expected and reached $2.411. The price moved above the channel limits momentarily but failed to achieve sufficient confirmation and momentum to sustain the breakout which resulted in the price entering a consolidation phase. XRP traded within a horizontal range with $2.400 as support and resistance near $2.420.
At 05:10 UTC XRP price reached the lower range boundary positioned at $2.400. RSI and MACD showed oversold conditions which were followed by the formation of a golden cross that pushed the price back to its resistance level at $2.418. However, A decisive red full-body candle appeared at 55 UTC which interrupted the broader uptrend pattern observed throughout the session. The RSI showed an oversold condition while a new death cross formed on the MACD which supported ongoing bearish momentum.