
Ethereum’s market value demonstrated robust growth alongside a crypto market recovery that led Bitcoin to reach unprecedented heights. The value of a leading altcoin had a 45% increase in the previous month, which led analysts to adopt an optimistic outlook. The inverse head-and-shoulders chart pattern bolsters the Ethereum price prediction, suggesting a significant Ethereum price breakout is imminent, targeting the $3,000 mark in the near term.
The journey toward the $3,000 price target faces immediate challenges. ETH has a significant resistance barrier between $2,700 and $2,800. On-chain data shows that many investors have their cost bases at this level, which suggests increased sell-side pressure since numerous long-term holders near their breakeven points look to exit positions after being underwater for extended periods.
Unpacking ETH Price Analysis: The Inverse Head-and-Shoulders
After conducting a thorough technical analysis of Ethereum, crypto analyst Ted Pillows, leveraging comprehensive ETH price analysis, discovered an inverse head-and-shoulders pattern on the cryptocurrency’s 12-hour daily chart, which signals a classic bullish reversal. The inverse head-and-shoulders formation started in February when Ethereum experienced a steep drop to $2,000, which established the left shoulder. In early April, the “head” formed after prices fell deeper to $1,400. After the price bounced back to $2,700 Ethereum entered a consolidation stage, which completed the “right shoulder” of the pattern.
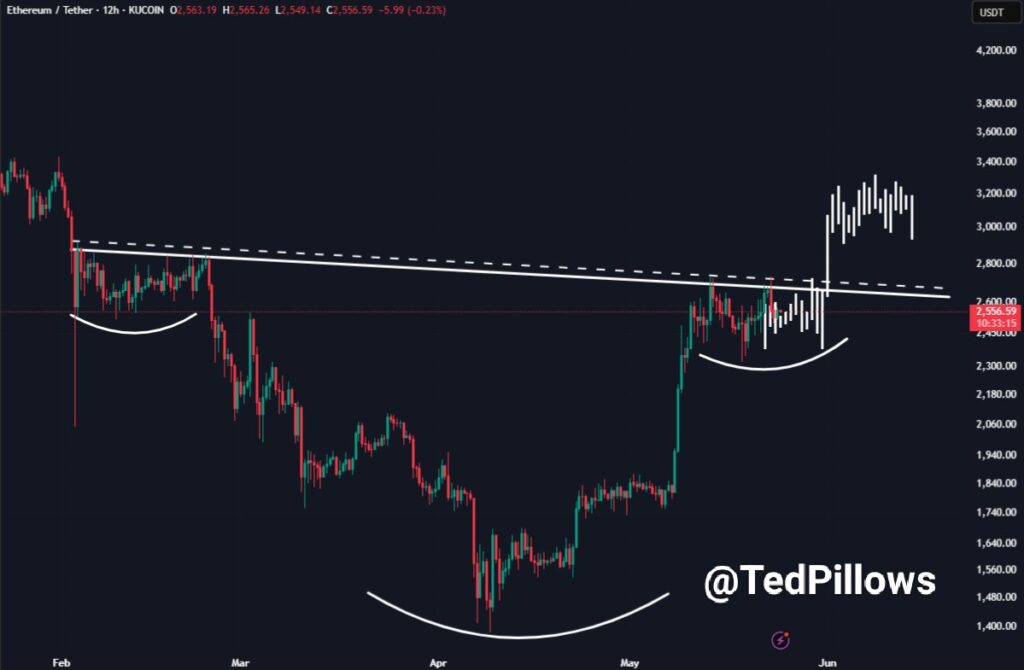
Pillows’ analysis identifies $2,700 as the key neckline level for this chart pattern. The bullish breakout requires Ethereum bulls to secure a decisive close above the resistance level to confirm their success. Pillows anticipates that the altcoin will rapidly reach $3,000 if successful in its efforts, creating a potential 17.4% rise from its current trading value.
Understanding Ethereum’s Critical Price Resistance
The upward movement of Ethereum faces resistance from a large concentration of supply at approximately $2,800. According to Glassnode’s on-chain analytics there exists a substantial cluster of Ethereum tokens held by investors who purchased at this price level. The data shows that many ETH holders who purchased below the current price since early 2025 have now started to reach their breakeven point.
This concentration could trigger increased sell-side pressure. When Ethereum reaches $2,800 its long-term investors might decide to take neutral exits, which would halt the rally. Ethereum must rely on the market’s capacity to absorb excess supply in order to break through this price ceiling and validate the optimistic Ethereum price prediction of reclaiming the $3,000 milestone.
Ethereum’s Strong Support and Market Fundamentals
Ethereum maintains strong foundational support even when facing immediate resistance. According to Sentora data, crypto analyst Ali Martinez identifies $2,330 to $2,410 as a significant demand zone. The critical area represents a robust support floor for Ethereum since 2.58 million addresses maintain over 63.65 million ETH, which can help mitigate potential price declines.
Ethereum currently trades at around $2,500, which places it between significant resistance above and substantial demand support below, a key factor influencing the immediate Ethereum price prediction. Although network activity has lessened with both trading volume and fees declining, Ethereum price dynamics have remained strong, a phenomenon closely watched in ETH price analysis, even in the face of recent significant ETH inflows to exchanges.
The Road Ahead: Confirming Ethereum’s Breakout Potential
Ethereum stands at a critical crossroads where strong bullish patterns face off against strong resistance above. The inverse head-and-shoulders pattern robustly supports a positive Ethereum price prediction, projecting a clear path towards $3,000, yet the immediate hurdle at $2,700-$2,800 from investor cost bases must be overcome for this projection to hold true.
The upcoming days become vital as traders observe whether demand strength can offset potential sales by long-term investors. Ethereum currently stands on strong support beneath it, which sets the stage for either a confirmative Ethereum price breakout or a consolidation phase, demonstrating the complex relationship between technical indicators and on-chain metrics that will influence its near-term progress.