Chainlink (LINK) demonstrates strong bullish signals through its steady recovery from mid-April lows, which sets the stage for a major upward move and inspires positive Chainlink price forecasts, fueling an optimistic Chainlink price prediction. The LINK market shows signs of recovery because technical signals indicate strength, while volume patterns move dynamically, and market sentiment shifts toward a positive direction, signaling a possible increase to $17, indicating a strong LINK market recovery. The current market momentum indicates that LINK might be approaching a significant breakout moment.
The recent market behavior showing moderate price improvements alongside stronger market indicators supports this positive outlook. For Chainlink to advance its market position, it must break through important resistance points. As current market momentum continues and buying pressure grows stronger, market experts predict LINK will strengthen its recovery path, which will make reaching its $17 price target more feasible as market conditions advance, reinforcing a positive Chainlink price prediction.
Recent Chainlink Price Swings and Market Consolidation
Chainlink saw major price fluctuations from May 20 to May 23 as its value climbed from under $15 to more than $17. The substantial growth in Aggregated Open Interest (OI) demonstrated on the hourly LINK/USDT chart from Binance supported the sharp uptrend while signaling increased market involvement and new long position entries. The market resistance triggered a quick downturn in LINK price and Open Interest because traders engaged in profit-taking or liquidation activities.
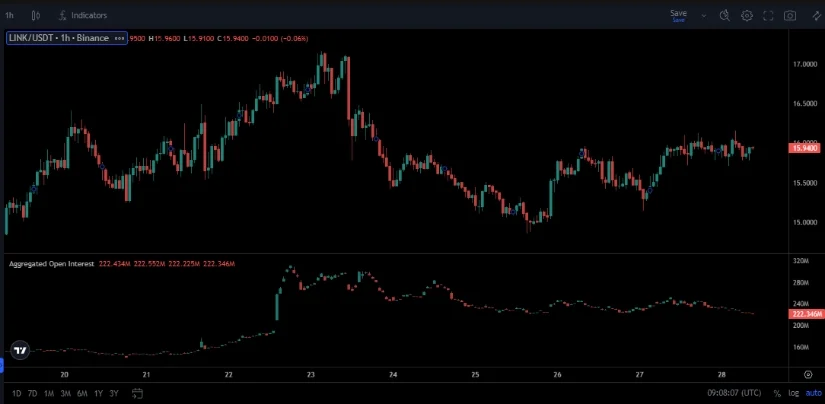
Between May 24 and May 26, LINK saw a consolidation phase, with its price remaining stable between $15.50 and $15.90. The price stabilization period coincided with declining open interest levels, suggesting that traders had reduced leverage and opted for a “wait-and-see” approach. Recent Chainlink technical analysis identifies the combination of a confirmed open interest increase and a price movement above the $16 marker as essential proof of renewed positive sentiment for the asset.
Accumulation and Strong Volume Drive Chainlink Optimism
Chainlink’s price displayed strong recovery characteristics between May 25 and May 28 as it moved between $15.40 and $15.90 and reached a 4.03% increase. The price showed steady upward momentum toward $16, which displayed renewed bullish interest and continued buying pressure after a brief downturn. The trading volume climbed to $338.88 million during this period, which consistently increased and usually boosts confidence for trend persistence while aiding further price gains.
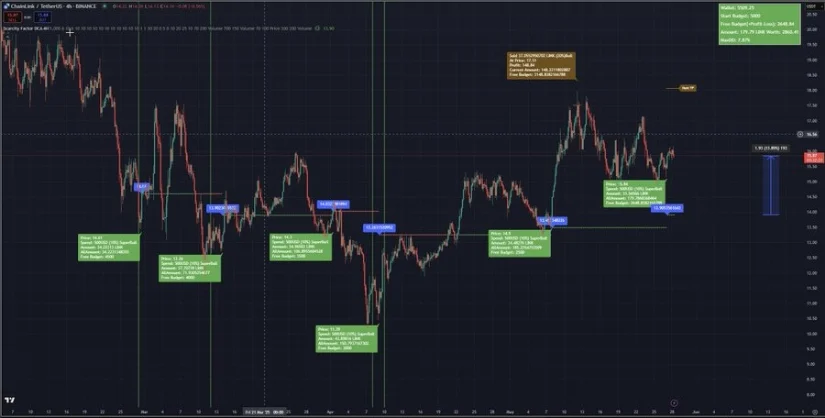
Market analysts commenting on X disclosed that automated trading platforms have consistently built up LINK positions, which now demonstrate an average profit margin of 13%. Systems holding capital for potential future reinforcement reflect the view that accumulation persists below the $16 resistance level, further supporting a strong Chainlink price prediction. As the leading decentralized oracle network, Chainlink maintains its essential functionality, which strengthens its long-term demand.
Key Chainlink Technical Signals Point to Trend Shift
On the weekly chart, Chainlink technical analysis demonstrates a steady, albeit subdued, reversal attempt since mid-April, which established support around the $12 mark. The asset trades at $15.922 while showing a weekly increase of 2.46%, but stays confined within a narrow trading range as market indecision persists against approaching critical resistance levels. The Chaikin Money Flow shows a reading of -0.09, which points to capital exits, while recent trends demonstrate a decrease in this bearish trend.
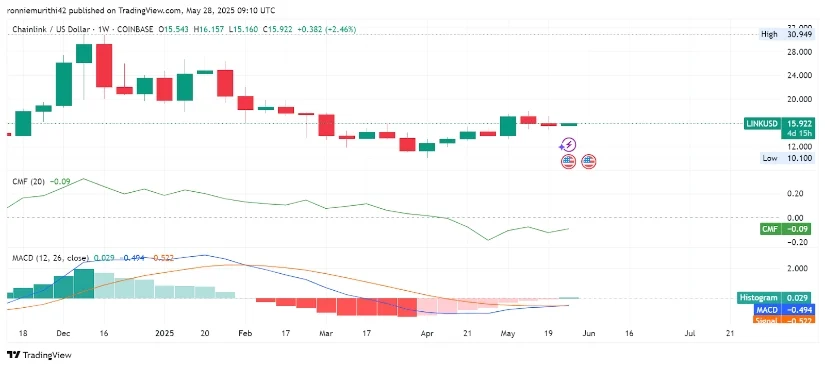
The Moving Average Convergence Divergence (MACD) indicator reveals initial indications of a bullish crossover development. The MACD line continues to stay under the signal line while its histogram displays a positive value of 0.029. The positive shift signals the potential start of a substantial trend reversal, indicating a decrease in selling pressure. An upcoming MACD crossover confirmation would strongly support Chainlink’s expected rise toward the $17 target, bolstering the current Chainlink price prediction.
Chainlink Outlook: Awaiting Confirmation for Upside Potential
Chainlink’s potential upward trend faces its most immediate critical challenge at the $16 resistance level. When Chainlink breaks through the $16 resistance level with concurrent increases in trading volume and open interest, this will demonstrate strengthened buyer conviction. LINK is expected to surge quickly to the $17 target if this move takes place. The inability to surpass the $16 threshold will likely result in Chainlink remaining confined in the trading range between $15.40 and $15.90.
Chainlink’s near-term future depends on maintaining current performance levels while confirming vital technical indicators and surpassing key resistance barriers. The combined effects of increased investor interest and better technical signals with steady trading activity suggest Chainlink can achieve another upward phase if broad market conditions remain favorable for sustained LINK market recovery.